In the field of industrial machinery operation and maintenance, accurate signal measurement is important for ensuring optimal performance and preventing potential breakdowns. Discrepancies in instrumentation or sensor readings between different monitoring systems can pose challenges in diagnosing equipment health.
This article addresses such a scenario, where variations in radial vibration readings were observed between a turbine’s local PLC turbine control system and a vibration monitoring system package.
Through meticulous analysis and calculation, we delve into the underlying factors contributing to these differences, shedding light on the importance of scale factor configuration, amplitude signal selection, and the implications for machinery diagnostic practices.
By unraveling these intricacies, we aim to provide insights for troubleshooting and ensuring consistency in instrumentation sensor measurement across monitoring platforms.
Issue Highlighted: Reading Was Not The Same
Turbine control system vendor highlighted when radial vibration was simulated, value receives at their panel was not that same as what had been displayed at vibration monitoring system.
For Example, if 20 um was simulated and shown at turbine control system, then what had been displayed at vibration monitoring system was 40 um pp.
Transducer Scale Factor
Shown below was the transducer setup in vibration monitoring system.
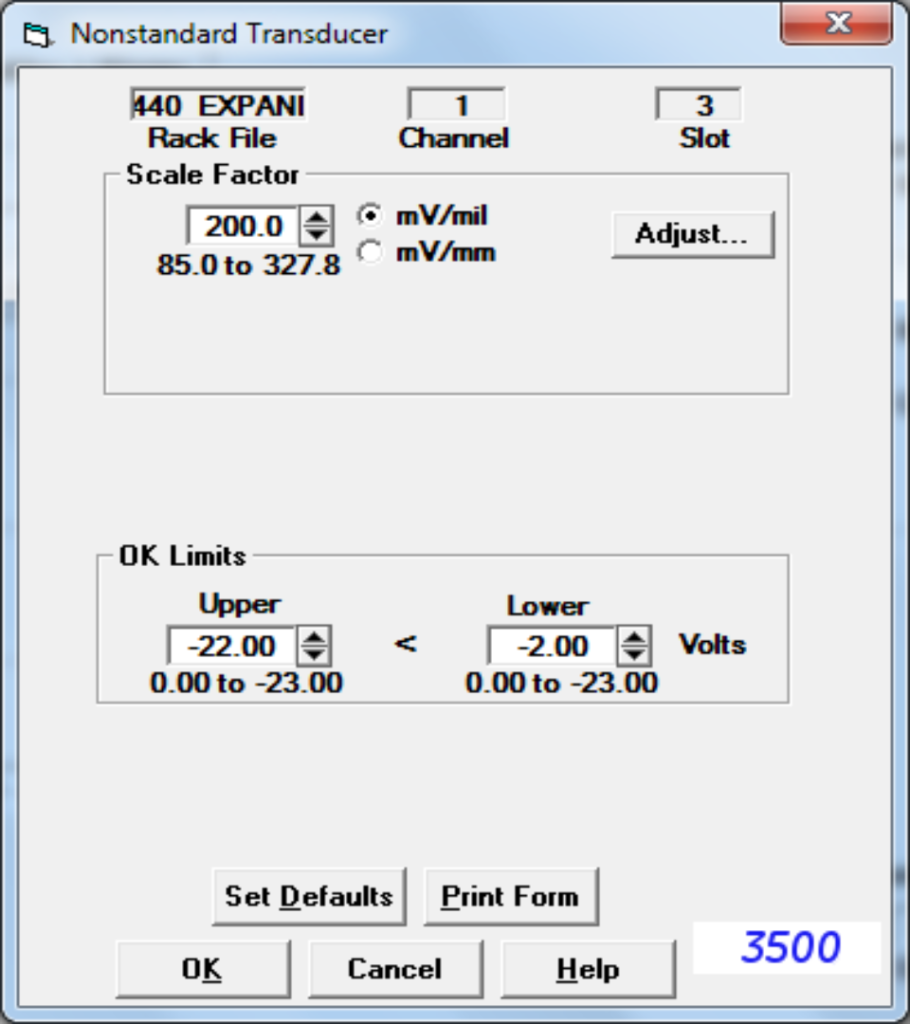

Even the transducer selected is a nonstandard transducer, but the scale factor was adjusted to follow vibration monitoring system 8mm proximitor transducer system.
200mV/mil pp which is in English/Imperial unit, is equal to Metric unit 7.87mV/um pp.
It means that if 7.87mV pp is simulated, then vibration of 1 um pp will be generated at vibration monitoring system.
Root Mean Square and Peak-to-Peak Waveform
Vrms vs Vpp:
Amount of AC voltage sinusoidal wave amplitude that is simulated can be verified using digital multimeter. It is measured in root-mean-square (rms) unit.
For sine wave:

Vp is the peak voltage which is half of the peak-to-peak voltage, Vpp.
Vp = Vpp / 2
Therefore,
Vrms = (Vpp / 2) x (1 / √2)
Vrms = (Vpp / 2) x 0.707
Sine Wave Amplitude Simulation
During the test, Vrms value of approximately 115mVrms was simulated (measured using multimeter).
Result observed at turbine control system: approximately 20 um.
Result observed at vibration monitoring system: approximately 40 um pp.
Verification using formula:
Vrms = (Vpp / 2) x 0.707
Therefore,
Vpp = (Vrms x 2) / 0.707
Vpp = (115mV x 2) / 0.707
Vpp = 325.32 mV pp
Using the selected scale factor 7.87 mV/um pp, then corresponding value in um pp was generated:
7.87 mV pp à 1 um pp
Therefore, 325.32 mV pp
= (1 um pp x 325.32 mV pp) / 7.87 mV pp
= 41 um pp
From the calculated value, it is justified that value recorded (measured in um pp) at vibration monitoring system is correct and as expected.
Probabilities Lead to the Highlighted Issue
Two probabilities that could be possible for this case:
- Scale factor of transducer proximity system being configured at turbine control panel not similar to vibration monitoring system.
- Selection between peak-to-peak (pp) or 0-to-peak (pk or p) amplitude for vibration measurement determination\
First Probability: Different Scale Factor Configuration
From the sample calculation of amplitude simulation in previous section (Sine Wave Amplitude Simulation section), scale factor value would affect the vibration measurement reading.
As an example, in vibration monitoring system, the configured scale factor was 200 mV/mill pp which is equivalent to 7.87 mV/um pp.
Referring back to signal simulation in previous section, where 115mV-rms being generated, with the configuration of 7.87 mV/um pp scale factor, vibration amplitude generated was equal to approximately 41 um pp.
Now, let us conduct a calculation if the transducer of proximity system was configured as 400 mV/mill pp, when converted into metric measurement, it was equal to 15.748 mV/mm pp.
Verification using formula:
Vrms = (Vpp / 2) x 0.707
Therefore,
Vpp = (Vrms x 2) / 0.707
Vpp = (115mV x 2) / 0.707
Vpp = 325.32 mV pp
Now using the scale factor of 15.748 mV/um pp (400 mV/mill pp), then corresponding value in um pp was generated:
15.748 mV pp à 1 um pp
Therefore, 325.32 mV pp
= (1 um pp x 325.32 mV pp) / 15.748 mV pp
= 21 um pp
Second Probability: Selection between peak-to-peak (pp) and 0-to-peak (pk or p) Amplitude
For vendor who always working with absolute vibration sensors, where it would normally consists of application of accelerometers and velomitors, where the measurement unit would be 0-to-peak (pk or p) amplitude, while for the case of this relative vibration, the measurement unit to be applied in determining the vibration value would be in peak-to-peak (pp) amplitude signal.
If this formula is being used without considering the peak-to-peak (pp) amplitude signal:
Vrms = Vp x (1 / √2)
Vrms = Vp x 0.707
therefore:
Vp = 115mV / 0.707
Vp = 162.66 mV p
Then, if this value was used by interpolating the 7.87 mV/um without considering the peak-to-peak (pp) measurement,
Therefore 162.66 mV
= (1 um x 162.66 mV) / 7.87 mV
= 21 um
This explains why the value recorded at turbine control system and vibration monitoring system are different by half.
Cross Check, Verify and Confirm
Radial vibration measurement in vibration monitoring system will always measure in peak-to-peak value either in um-pp or mil-pp.
This peak-to-peak value which was sent to machinery diagnostic software was required for machine monitoring and diagnostic purposes. And the calculation proves that the value recorded in vibration monitoring system rack is correct.
It is suggested that the other vendor in this case turbine control system team to considerably check and verify via their system application on these highlighted parameters which are the scale factor configuration of proximity transducer system and the amplitude signal being selected for the determination of vibration measurement value.